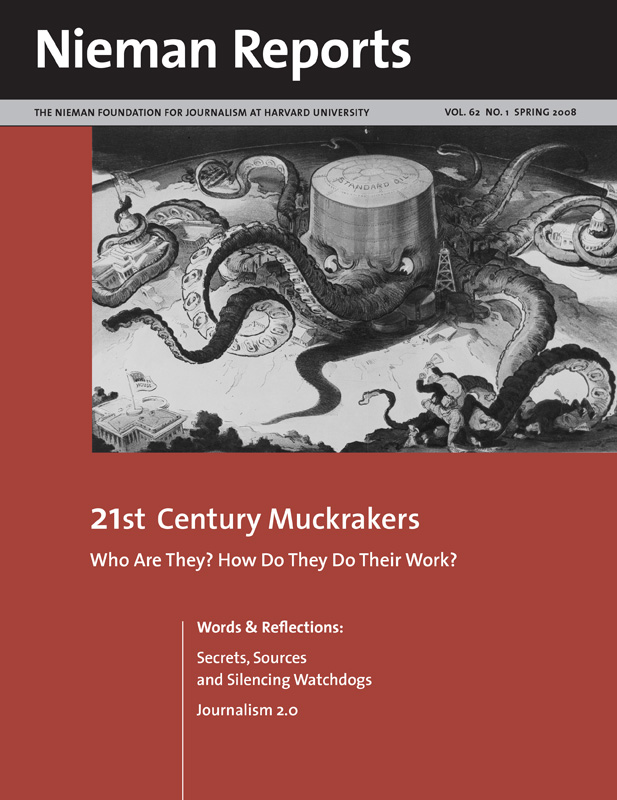
21st Century Muckrakers
Watchdog reporting resides at the core of what journalism does. Its roots dig deeply into the common ground uniting the muckrakers’ unearthing of public and private scandals a century ago with what investigative reporters are illuminating today. Though reporting and distribution of this news is very different in the digital era, unfortunately the human conditions requiring press scrutiny are not. These include patterns of corruption and malfeasance among those holding powerful positions of public and private trust.
Cynics would say “precision journalism” is an oxymoron, like unbiased opinion or civil war. But precision is an ideal to be sought in journalism, though not often achieved.
As defined by Knight Ridder reporter Philip Meyer in his groundbreaking 1973 book of the same name, precision journalism is the use of the tools of social science to replace, or at least supplement, reporters’ time-honored methods of citing anecdotal evidence and doing educated guesswork. Today, thanks to Meyer’s call, I’m one of hundreds of investigative reporters who have crafted serious stories using such tools as survey research, statistical analysis, experimentation and hypothesis testing. It’s social science done on deadline.
As it happens, I got a glimmering of these methods even before I discovered journalism as a career. In my freshman year at Dartmouth in 1966, I slogged my way to a so-so grade in calculus, the last math course I ever took. I remember little calculus today, but I did learn something my professor, John Kemeny, had coauthored two years earlier: the computer language BASIC. I thought it very cool that I could peck a few lines of English-like instructions into a teletype machine and seconds later a mainframe computer somewhere on campus would calculate precinct-level vote percentages for my American Government homework.
However, it was 15 years later before I got a chance to start applying such methods to my journalism. The problem was that much of what Meyer recommended could best be done with a computer, which during the 1970’s meant big-iron mainframes that only universities or corporations could afford. It was nearly a decade before personal computers were developed and usable by nontechies like myself.
By then, in 1981, I was a reporter in The Miami Herald’s state capital bureau, and I had bought an Atari 800 computer to play with at home. I quickly realized that my expensive toy could help me do my job better. I relearned BASIC, then persuaded my editors to buy one of the new-fangled IBM PCs for me to use at work. At one point, I spent a week writing and debugging a program that would take a legislative roll call vote and produce cross-tabs not only by party but also by such other revealing political demographics as race, gender, geography, leadership position, and source of campaign contributions. It would even write the roll call agate we appended to legislative stories. (Today, of course, such an application could be built in minutes with off-the-shelf database software.)
A couple of years later, I got to meet Meyer for the first time. He did a day-long training seminar at the Herald attended by a few of us, including Richard Morin, who later would go on to be the polling director for The Washington Post for nearly 20 years. Rich and I, in particular, came away from that seminar inspired to be precision journalists.
RELATED ARTICLES
“Building a Toolbox for Precision Journalism”
– Stephen K. Doig So I spent the next decade at the Herald teaching myself, in bits and pieces, the social science tools I hadn’t had enough sense to study when I was in college, from statistics to cartography. An example of my academic cluelessness came in 1991, when I was working with Knight Ridder colleagues Dan Gillmor and Ted Mellnik on a project about racial segregation in the United States using just-released census data. I spent days trying to noodle together some way to measure the degree of segregation in a community, but nothing useful emerged. I finally mentioned my frustration to Mellnik, who then mentioned it to a friend who was a sociologist. “Oh, you want the dissimilarity index,” the friend promptly replied, giving Mellnik a citation for an article describing it in a scholarly journal from the 1950’s.
Armed with that already-invented tool, a month after the decennial census data was released we produced our analysis of how segregation had—or hadn’t—changed in every state, county and city across the country since 1980. For expert comment on what we had found, Gillmor called William Frey of the University of Michigan, one of the nation’s leading demographers. He was stunned. “My god, I had no idea newspapers could do that kind of work,” Frey told Gillmor, adding that he hadn’t even started thinking about the grant applications he would write in hopes of doing a similar analysis in the next few years. We had put the social scientists on notice that journalists increasingly would be competitors in their field. And I’m proud to say that we also beat Meyer, by then a Knight Chair at the University of North Carolina in Chapel Hill, to the story; unknown to us until later, he was a consultant to USA Today reporters who were working on a similar analysis.
By then, there was a growing band of investigative reporters doing ever-more sophisticated studies using precision journalism techniques. One of the best-known examples at the time was the “Color of Money” project that used hard data to document so-called “redlining” by banks that were denying mortgage loans to black residents of Atlanta, which won a 1989 Pulitzer for young Atlanta Journal and Constitution reporter Bill Dedman.
In a case of chance favoring the prepared mind, my opportunity to use precision journalism on a huge story arrived on August 24, 1992, when Hurricane Andrew tore across the south end of Miami with winds exceeding 150 miles per hour. Andrew destroyed or heavily damaged more than 80,000 homes—including my own. In the weeks that followed, as Herald reporters were covering the daily events of recovery across the battered region, our investigative team met to see how we might determine whether the extent of this disaster was simply an act of God or the inevitable result of our collective stupidity.
I realized that I could merge our growing database of damage reports with the property tax roll, which would allow us to study the storm’s damage patterns. When I ran the numbers, I found the first smoking gun of my career. There was no pattern to be seen when I compared storm damage to such variables as home value, type of construction, location or distance from the shore. But there was a strong, counterintuitive pattern connected to the year of construction: The newer the home, the more likely to be destroyed. We went on to uncover the reasons for this in other datasets we gathered, including millions of records of often-hasty building inspections and millions of dollars in campaign contributions to politicians who had approved weakened building codes at the urging of the construction industry. Our report, called “What Went Wrong,” was published three months after the storm.
After that, Herald reporters and I investigated other big social problems by using hard data, including an examination of South Florida’s overwhelmed criminal justice system and a probe of immigration’s effect on our region and the country.
EDITOR’S NOTES
1.Hacker and Oklahoma State University journalism professor Stan Ketterer are working on a book about using advanced statistics in reporting.
2.This year, the Meyer Award was given to The Dallas Morning News for “Faking the Grade.” This series, by reporters Joshua Benton, a 2008 Nieman Fellow, and Holly Hacker, uncovered strong evidence of cheating on standardized tests by more than 50,000 students in Texas public and charter schools. Teaching the Tools
I left the Herald in 1996 to become a professor of journalism. Each semester, I teach our best students some of the precision journalism techniques that I still wish I had learned back in college. I also continue to work with investigative reporters who are following the path first laid out by Meyer. For instance, in advance of the 2000 Census, USA Today database editor Paul Overberg and I taught hundreds of reporters the tools needed to interpret the data—including the dissimilarity index—in a series of workshops around the country organized by Investigative Reporters and Editors (IRE). And with the help of numbers-savvy IRE stalwarts like Jennifer LaFleur and Holly Hacker [see note 1], I host an annual three-day statistics boot camp for reporters who are ready to move beyond spreadsheets to learn tools like correlation, regression, sampling, hypothesis tests, and probability.
Finally, the use of such tools has become so common that three years ago I joined with IRE to create the Philip Meyer Awards [see note 2] for precision journalism honoring the best investigative reporting done each year using social science techniques. Winners and other strong entries have used clever statistical methods to uncover cheating scandals in public schools, backdated stock options, flaws in ballot designs, origins of the methamphetamine epidemic, and systemic problems with veterans’ medical care, among many noteworthy stories. What Meyer dreamed of 35 years ago—a cadre of journalists who use the scientific method—precisely has come to pass.
Stephen K. Doig is the Knight Chair in Journalism at Arizona State University’s Walter Cronkite School of Journalism and Mass Communication. Precision journalism projects on which he worked during his 19 years at The Miami Herald won the Pulitzer Prize for Public Service, the IRE Award, and the Goldsmith Prize for Investigative Reporting.