Technology
March 23, 2009

Tracking Toxics When the Data Are Polluted
How computational journalism can uncover what polluters would prefer to hide.
Article by

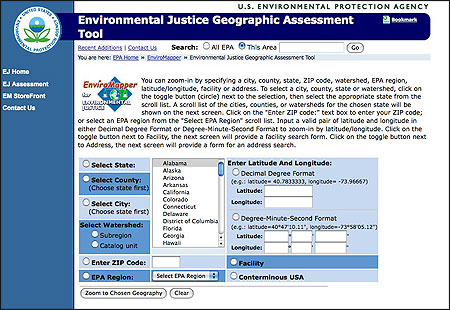
Tools found on this EPA Web site enable people to find polluting facilities in their neighborhoods. In the future, algorithms could use this information to “write the story of your local environment.” —J.T.H.
Each year the U.S. Environmental Protection Agency’s Toxics Release Inventory (TRI) program releases information from more than 20,000 plants on their self-reported emission and transfer of nearly 650 chemicals.
In the early years of the program, the failure of a plant to file a TRI report arose more from ignorance about the reporting requirements than evasion of the law. Those guilty of nonreporting tended to be small facilities releasing small amounts of toxics. The pollution reports did attract attention from investors, causing stock prices for some firms to decline when the data became public. For companies releasing carcinogens into the air, plants whose emissions generated higher than expected cases of cancer ended up reducing their emissions more.
But the nature of the surrounding community affected these decisions. The higher the voter turnout in an area around a plant, a proxy for residents’ political power, the greater the facility’s reported reductions in air carcinogens. Yet not all the reports of pollution reductions may be real. When you compare TRI reports of pollution releases with actual measures of nearby pollution, for heavily regulated chemicals such as lead and nitric acid it appears that firms are not accurately reporting their emissions.
It took me more than 10 years of study to generate these results about the TRI program, which are summarized in my book “Regulation Through Revelation: The Origin, Politics, and Impacts of the Toxics Release Inventory Program.” Originally, to study the TRI I had to stay up late at night so that I could mount large tapes on a university’s mainframe computers and run regression analyses when computer time was relatively cheap. Now the TRI data are freely available online at www.epa.gov/tri, and the calculations that took me days can be done with a click on the EPA site. The easy availability of data makes the TRI a likely source for environmentalists, community groups, and regulators.
Journalists have also used the TRI since its inception. USA Today ran a series when the TRI data were first released in 1989 based on a three-month investigation and extensive computerized analysis. The rapid advances in computer power, data availability, and algorithms mean that TRI data may now serve as inputs into a newly evolving form of reporting—computational journalism.
I view computational journalism as the combination of data, algorithms and knowledge from social science to yield information that can supplement and, in the future, substitute for part of journalism’s watchdog function. By supplement, I mean that analyses like text mining and cluster analyses can generate electronic tips that lower the cost to reporters of deciding what and where to investigate. By substitute, I mean that eventually some watchdog articles will be written by algorithm in a way that would allow readers to see a customized, personalized article about how a policy problem is playing out in their neighborhood, block or lives.
How might this work? Consider how a reporter could investigate the local chemical data provided by the TRI.
Statistical Analysis: Some numbers follow Benford’s Law, which means that if you look at the distribution of first digits, 1s outnumber 2s, which outnumber 3s, and so on. Work in forensic accounting shows that when people fudge their numbers they forget to do it in a way that replicates Benford’s Law. This means that analysis of first digits is a way to check the accuracy of self-reported data. In looking at the actual level of pollution near plants reporting TRI emissions, Scott de Marchi and I found that for the chemicals such as lead and nitric acid, the measured pollution concentrations around plants followed Benford’s Law. But the self-reported data did not. This suggests that for these two heavily regulated chemicals, TRI reports may not be accurate. The TRI form actually provides a name and phone number if the public has questions about a plant’s reports, which could be a starting point for reporters investigating the accuracy of TRI data.
No change: If facilities are not serious about their pollution estimates, they may fall back on a simple rule of thumb—simply report the same pollution figures each year. I got the idea for this test after reading David Barstow and Lowell Bergman’s Pulitzer Prize-winning investigation of workplace injuries and deaths at McWane manufacturing plants. Thinking that a company willing to violate workplace regulations so egregiously would not be likely to invest much time in estimating its pollution releases, I looked and found that TRI reports at McWane at times simply remained the same from one year to the next. When de Marchi and I checked nationwide, we found that plants where pollution levels stayed the same across years were likely underreporting their actual emissions. Journalists looking for underreporting can start by seeing which local polluters report the same figures year to year.
Visualization: I have found across environmental programs that even after you take into account income and education levels, areas with higher voter turnout get better levels of environmental protection. The higher the voter turnout in an area, the greater the reduction in air carcinogens, the more stringent the Superfund cleanups at hazardous waste sites, and the lower the chance that hazardous waste processing capacity will be expanded in the area. One way for online news sites to show the relation between pollution and politics is to show how voting rates differ around polluting facilities. In a state such as North Carolina, you can purchase from the State Board of Elections the voter registration file for the entire state for $25. This shows the addresses of registered voters and whether they turn out at the polls, too. Voter address data can be used to create maps that show how political activity varies across streets and neighborhoods.
Mapping: The TRI forms provide the address for where polluting facilities ship their toxics for disposal. The records generated by the Resource Conservation and Recovery Act contain similar information for where nonmanufacturing firms send their waste. In my environmental policy classes, we track where (radioactive) medical waste from Duke ends up. Such data would allow reporters to show whose toxics are ending up in your local area and what neighborhoods in the United States end up receiving waste shipped from your area.
Matching: To find people who should have reported TRI emissions but did not, regulators initially compared local business directories and manufacturing lists with the facility name and addresses of TRI filers. In some industries, the production process almost by definition would entail the release of particular chemicals. The easy availability today of detailed information on plants and facilities makes this a matching process that journalists can conduct on their own. This would be especially helpful in discovering violators when programs are new and word of requirements has not traveled widely.
Personalization: Right now the EPA collects pollution data from multiple programs into the Envirofacts database and merges environmental data with community information in the EnviroMapper function. In the future, algorithms could take this information and write the story of your local environment, letting you know likely exposures from different facilities, types of enforcement actions recently taken at nearby plants, trends over time in local public health, pictures of emitting facilities, and how these pollution patterns compare across time and across other areas in your city.
Data from the TRI can at times be controversial, imperfect and (strategically) slanted. Yet as the field of computational journalism develops, the use of algorithms and knowledge from social science should allow reporters to use data such as the TRI to lower the cost of generating watchdog coverage and raise interest in political issues by personalizing the impact of public policies.
James T. Hamilton is the Charles S. Sydnor Professor of Public Policy Studies at Duke University and the director of the DeWitt Wallace Center for Media and Democracy.