
Money — who gets it and where it comes from — is at the heart of transportation politics. And when it comes to highways and transit, there is plenty of money in question. The problem, as reporters well know, is that there never seems to be enough money to go around, and even after major projects are begun they always wind up costing much more than they were supposed to.
The questions for reporters, therefore, are how much money, where does it come from, and where does it go?
The first thing to appreciate in answering these questions is the sheer magnitude of transportation spending in the United States. In 1993, for example, all levels of government in the United States spent $68.7 billion on highways — more than they spent on police or fire protection, natural resources, sewage treatment, housing and community development, or parks and recreation. Put another way, the only things we spend more on than highways are entitlement programs, education, interest, public welfare, hospitals and government administration.
Transportation also is particularly important to state policymakers because after Medicaid, the federal highway-aid program is the largest direct grant that the federal government makes to state governments. Small wonder then that states that believe they “lose” in existing funding formulas are fighting bitterly to change those formulas while those that “win” are fighting just as hard to protect them.
The second thing to appreciate about highway spending is that contrary to popular perceptions that spending on roads is falling (which in turn is causing roads and bridges to crumble), total spending on both highways and transit is at an all-time high. A 1993 Congressional Budget Office report, for example, found that in constant (that is inflation-adjusted) dollars, total spending by all levels of government on transportation rose from$ 57 billion in Fiscal Year 1960, to $76 billion in 1970, to $81 billion in 1980. After declining in the early 1980’s, spending began rising again and by FY 1990 (the last year CBO had data available) it had risen to $99 billion.
These increases held across all important modes of transportation. In constant dollars, highway spending went up by 50 percent, from $44 billion in 1960 to $62 billion in 1990; spending on transit increased fivefold (from $3.8 billion to $18.3 billion); and aviation spending tripled (going from $4.2 to $12.6 billion). Subsequent reports by the U.S. Department of Transportation indicate that these trends have continued through the mid-1990 's though there appears to have been a slight decline in spending in 1993, the last year for which statistics are available.
The overall increases in spending mask another important trend: a shift in responsibility for funding highways. Thus, in percentage terms, while the federal share of spending rose just after passage of the Interstate Highway and Defense Act of 1956, it has been declining since the early 1960’s. Meanwhile both the state and local shares of spending have increased. This trend is in keeping with the literature on economic development, which suggests that roads and other transportation facilities contribute significantly to regional economic competitiveness. For this reason, scholars — such as former Director of the Office of Management and Budget, Alice Rivlin — generally believe that states and localities, not the national government, should pay for such projects. The economic reality, however, must compete with the political reality that projects are much more feasible when funding comes from higher levels of government and beneficiaries don’t believe they have to foot the bill for them. Consequently, state and local officials, along with businesses whose fortunes are tied to specific places (such as developers, newspapers and utility companies) often lobby Washington intensely for money.
Where Does the Money Come From?
The funds that pay for highways come from several sources, most significantly taxes on gasoline. At the federal level it is critical to remember that unlike all other industrialized countries the U.S. federal government historically did not use gasoline tax revenues for anything other than highway improvements. In the 1970’s and 1980’s, however, some gas taxes were devoted to transit and in 1990 and 1993 the federal government used increases in gasoline taxes for deficit reduction.
Since 1993, there have been several quiet but extremely significant shifts in how the federal government accounts for this money. Initially, the money raised from gas taxes for deficit reduction was credited to the federal government’s general fund while the rest of the money was credited to the Highway Trust Fund. In recent years, however, highway interests and senior members of Congressional transportation committees have succeeded in having all gas tax receipts credited to the Highway Trust Fund.
At one level this is merely an accounting exercise because when the federal deficit is calculated, all funds are included, regardless of which “accounts” they were credited to. At another level, however, the shift sets the stage for potent arguments that federal policymakers are inappropriately using gas taxes that should be used to build roads to mask the federal deficit. Indeed, such arguments are currently being bandied about in the intense debates over how much to spend in the next federal-aid surface transportation act. The American Road & Transportation Builders Association, for example, contended in a recent press release that because a Senate bill reauthorizing surface transportation fails to spend all money deposited in the Highway Trust Fund it “would return only 75 percent of the highway user fees collected by the states back to them for highway and bridge safety improvements.”
Like the federal government, more than two thirds of the states have raised their gas taxes since 1990, although almost all that money has gone into transportation improvements. Despite the increases, however, there still is wide variation among state gas tax rates, which range from less than 10 cents a gallon in Georgia to more than 30 cents a gallon in Connecticut.
Bonds also are an increasingly important source of funds for highway improvements, rising, according to The Road Information Project, from about 5 percent of all highway funds raised by states in 1982 to almost 14 percent of such funds in 1992. As with motor fuel taxes, states vary widely in their use of bonds. At the end of 1995, for example, 11 states had more than $1 billion in highway bonds outstanding while 13 had less than $100 million in outstanding bonds and nine undertook no borrowing for highways at all.
What is particularly striking about state gas tax and borrowing proposals is that contrary to popular perceptions they generally are popular with voters. The Urban Institute’s George Peterson, for example, has found that approval rates for referendums for repairs and rebuilding (as opposed to new construction) have been even higher, generally running over 70 percent. In fact, even in the landmark 1994 elections more than 96 percent of all bonds fo; highways were approved by voters.
Tolls — which were a common source of funds in the early 1950’s but, due to a ban on using tolls on new Interstate highways were largely ignored until the mid-1980’s — also have reemerged as a major new source of funding. According to a recent report by the American Association of State Highway and Transportation Officials 14 states have opened or are constructing $7.5 billion in new toll roads and other revenue-producing transportation facilities such as toll bridges. Another $16 billion in projects is under consideration or on the drawing boards. The new roads generally have required tolls of more than 10 cents per mile while the older roads generally have tolls of less than five cents per mile. It is unclear if motorists will accept such tolls: Both the recently opened Dulles Greenway, a private toll road outside of Washington, and the new San Joaquin toll road in Orange County, California have generated significantly less traffic than anticipated, which has forced both roads to change their toll schedules and to restructure their bonds.
In addition to these traditional sources of funds, state and local policymakers also are looking at new taxes to fund roads. For example, 23 states have increased their reliance on other revenue sources, such as taxes on rental cars, general sales taxes, increased taxes on alternative fuels, and, in the case of trucks, taxes based on vehicle weight and total miles traveled. In addition, 22 states reported that they entered into some form of a public/private partnership or joint venture to help fund transportation improvements. Such partnerships usually involve private-sector donations of land for new facilities or private funding of new ramps and interchanges needed to serve new developments.
What Are We Buying?
The rise in total spending and the fact that highway spending seems to be popular with voters seem paradoxical in light of continued reports about deteriorating roads and bridges and ever-greater congestion. How can these two things happen at the same time?
To begin with, some statements are rhetorical overkill. In a recent Washington Post article, for example, Representative Bud Shuster (R-PA), who chairs the House Transportation and Infrastructure Committee and is an advocate of significant increases in transportation spending, contended that “America is growing and prospering but our transportation infrastructure is crumbling.” In fact, roadway conditions are improving. The U.S. Department of Transportation, for example, reports that the percentage of urban interstate highways in poor condition dropped from 16.8 percent in 1983 to 7.7 percent in 1991. (In 1993 U.S. DOT changed its road rating systems, so more up-to-date figures are not comparable with older figures.)
Various indexes, however, do suggest that highway congestion is worsening, particularly in the suburbs where an increasingly large proportion of Americans live and work. Thus it is entirely possible to be spending more money but for congestion to be gradually worsening. This, in turn leads to U.S. DOT estimates that while current spending is sufficient to maintain the physical condition of existing roads and bridges, preventing congestion from getting any worse would require spending at least another $20.2 billion a year on highways for the next 20 years.
Aggregate spending figures, moreover, may not capture important changes in spending patterns, which suggests that we may be spending more and more to get less and less. UCLA’s Brian Taylor, for example, has calculated that from the 1950’s until the 1980’s per-mile construction costs in California regularly outpaced inflation.
Three factors were particularly important in pushing up costs, Taylor found. The cost of land rose dramatically, as did the unit costs of highway construction (that is the amount it cost to grade and pave one mile of one lane rose faster than inflation). Basic highway designs also have become more complex over time as engineers moved to accommodate higher speeds and new safety considerations. Third, and least understood, environmental and other constraints placed on highways have added substantial costs not only by delaying projects but also by forcing expensive designs that minimize harm and extensive and often expensive efforts to mitigate real and perceived damages from projects that are built.
The Century Freeway, a 17-mile highway in and near Los Angeles, that was the last major interstate highway project in California, for example, could not proceed until CalTrans agreed to fund the construction of at least 3,000 units of housing to replace units taken for the road and to pay for job training and job placement programs for minorities and women from the neighborhoods near the road. The delays and the added commitments meant that the project’s cost rose from an estimate of $502 million in 1977 (before the commitments were made) to $2 .5 billion when it was finished in 1993. Even after accounting for inflation, this represents a 131 percent increase in costs.
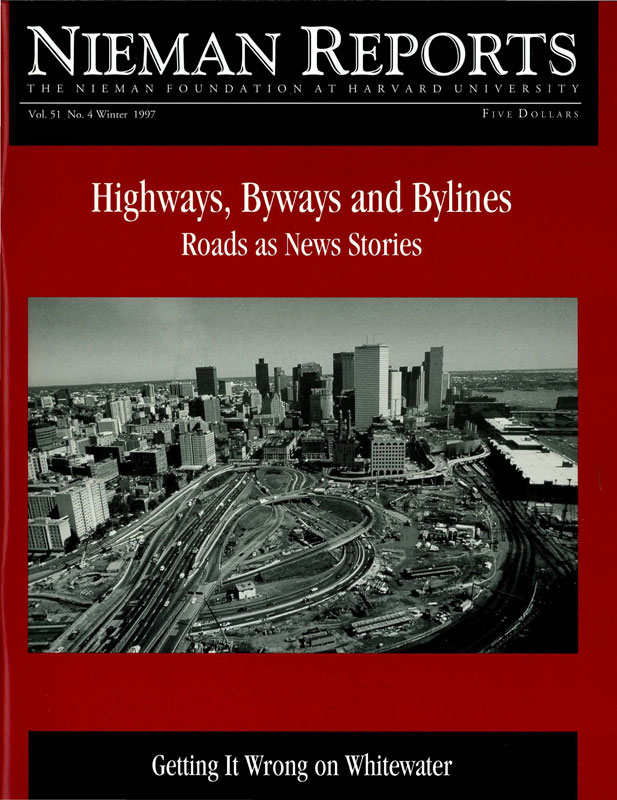
Another example of how changing norms can drive up costs is Boston’s $11 billion seven-mile long Central Artery/funnel project. Rather than creating a new right-of-way in downtown Boston, which would have required substantial takings, the project will tunnel under an existing downtown highway using expensive technologies that allow the existing highway to function while the tunneling occurs. Even with this seemingly sensitive design, the project faced a difficult permitting process in which state officials had to make hundreds of mitigation commitments and redesign a major river crossing at a cost of more than $1 billion. The result is that state officials now estimate that about a third of the project’s cost is estimated to be for mitigation.
How Much Is That Project In the Window?
The histories of the Century Freeway and the Central Artery/funnel projects illustrate a critical issue that merits reporters’ attention. Major transportation projects regularly are announced and approved with cost estimates that turn out to have badly underestimated their final costs. When proponents of the artery/tunnel project sought federal authorization for the project in the mid-1980’s, for example, they estimated that it would cost only $2.4 billion, less than a quarter of its current cost. Similarly, Denver’s new airport was pilloried because it cost almost$ 5 billion, more than three times what the city had estimated when it sought voter permission to build the project in the late 1980’s. And the Blue Line train from Long Beach to Los Angeles cost $890 million, more than four times the $194 million officials had estimated when that project began.
Such overruns, it turns out, can be predicted with remarkable precision, according to a study of about 50 major projects from around the world done by Edward Merrow for the Rand Corporation in the late 1980’s.
To begin with, initial estimates rarely include either allowances for inflation or interest repayments when funding is coming from bonds. Massachusetts officials, for example, estimate that more than half the increase in the artery/ tunnel project’s cost is due to inflation and the fact that, unlike previous estimates, the current estimate includes a factor for inflation.
Second, project scope usually changes. As design proceeds, for example, engineers sometimes find that initial assumptions about the depth of bedrock or soil conditions were wrong and require more expensive designs. Or planners can find that additional interchanges or ramps are needed, as they did on the artery/tunnel project and beneficiaries can lobby for additional entries and exits, as downtown businesses did in Boston when the artery’s design was being finalized.
Third, the use of new and untested technologies can drive costs up dramatically because planners don’t fully anticipate problems that might occur. The most notorious example comes from the new Denver airport, where the decision to build an automated baggage system ran up costs-about $50 million to build a duplicate conventional system plus several hundred million dollars in interest payments to cover the cost of delaying the airport’s opening.
Fourth, projects that have many discrete elements that must be coordinated with each other — such as the artery/tunnel project — also seem to experience greater cost increases than smaller, more discrete projects, probably because it is easier to estimate the costs of the latter.
Fifth, regulators concerned with areas such as the environment, labor relations, procurement procedures, worker health and safety can drive up costs dramatically. This does not necessarily mean that regulations are unnecessary but it does suggest that officials and/or the press might question the validity of particularly expensive and egregious demands.
Finally, while such problems can confront both privately and publicly owned projects, cost overruns generally are greater on publicly owned projects. There are two reasons why. Proponents of publicly funded projects sometimes lowball initial costs, believing that once a project is authorized it is unlikely that it will be canceled if costs rise, particularly if a project is already under construction. Public-sector owners also have less incentive to hold the line on costs, especially when funding comes in the form of grants from higher levels of government (as it did for Century Freeway and initially did for the artery/tunnel project) while local constituencies and regulators are demanding a share of project benefits. Merrow, for one, found that this factor, not systemic lowballing of cost estimates, explained most of the difference in cost growth between private and public projects.
Thus cost increases on major projects not only are likely, they are even predictable in their magnitude. Merrow, for example, calculated that for each area subject to stringent regulation, costs rose 75 percent above estimates. He also found that publicly owned projects were 50 percent more expensive than estimates while projects that used significantly new materials or construction methods were about 60 percent more expensive than estimates.
The question is: if the true costs of other projects were known, would worthy but expensive projects not get built? Consider, for example, that the Panama Canal cost twice its original estimate while the Suez Canal cost 20 times its original estimate. Studying the history of these and other projects several decades ago, John Sawyer concluded that the history of public works seems to suggest that such underestimation “appears to have been a condition of a successful enterprise.”
Reporters covering transportation, therefore, not only must understand broad trends in funding and spending, they also must grapple with a fundamental question about the nature of democratic governance. Is our political system so flawed that those who build transportation facilities cannot and should not tell the truth about costs and those who write about those officials shouldn’t press them on whether they are using realistic cost estimates? Doing so may allow the construction of facilities that ultimately prove to be valuable. But the price, not only in dollars but also in increased cynicism about whether public officials tell the truth and whether newspapers seek it out, may be too much to stomach.