
On October 11, 2011, Florida Highway Patrol trooper Donna Jane Watts clocked a car driving down the Florida turnpike at 120 miles per hour, well over the zone’s 70 mph speed limit. She tried to pull the car over, and the driver led her on a 7-minute chase. When he finally did stop, he expected that she would just let him go. He was, after all, a police officer in a marked squad car.
The traffic stop was big news in Miami-Dade County, mainly because the trooper arrested the off-duty Miami police officer, Fausto Lopez. Many people had seen police break the law, driving with excessive speed when they weren’t responding to a call.
“No lights. No sirens. Just speed,” says South Florida Sun Sentinel database editor John Maines, who saw that behavior himself when driving home from work late at night. However, despite the public perception that law enforcement officials were among the most reckless of Florida’s drivers, there was no definitive evidence to back the claims.
But the incident involving Lopez gave Maines and reporter Sally Kestin an idea: Maybe they could prove that Lopez, though an extreme example, wasn’t just an outlier—that, in fact, many police officers were speeding for no good reason.
They nailed the story by analyzing data collected by sensors. “It was using the technology from SunPass, the electronic tolls, that made us able to pull off this story. We wouldn’t have been able to do it without sensor journalism,” says Maines.
A sensor is any device that in some way detects and responds to a signal or stimulus. They can be simple, like a thermometer or a magnetic sensor, or be a more complex device that collects data, whether it’s the electronic tolls that detect the transponder in your car, the satellites miles above earth that take images of the world below, or a hand-held device that measures lead contamination or radiation. As part of a data-driven reporting approach, sensors can broaden the range of stories journalists take on and increase the authoritativeness of their accounts. “There’s a great deal of potential for sensors in journalism in specific areas,” says Kathleen Culver, director of the Center for Journalism Ethics at the University of Wisconsin-Madison, particularly for environmental journalism. “Sensors can help us with things like water quality, water level rise and decline; they can sense air quality, temperature changes and, in the event of catastrophes, things like radiation or gas leaks.”
Sensors can also help journalists hold individuals and institutions accountable, and even be used by others to keep journalists themselves in check. Such was the case when, after John Broder reviewed Tesla’s Model S electric car for The New York Times, claiming poor performance, Tesla responded by releasing logged vehicle data—captured by sensors capable of monitoring charging, travel times and distances, among other factors—to suggest Broder misused the car and exaggerated its issues.
Culver, who studies the ethical implications of data, sensors, and drones in journalism, notes that sensors are a powerful means for “serving people and helping them understand the environments around them.” Sensing tools also raise a number of ethical concerns, especially when it comes to sensors that are used to collect and share personal data.
Take, for instance, the cell phone you might be using to read this article. That cell phone is a sensor. It tracks your location. It can share that location with other people, journalists included. That sensor can be a powerful tool that gives journalists access to sources with first-hand knowledge of what is happening at an event where the journalist can’t be. But it can also represent an infringement on that person’s sense of perceived privacy. “We’re seeing a growing resistance to that,” says Culver. “People saying, ‘What are you doing?’, and reporters saying, ‘This is our job.’ But I think that’s an insufficient answer.”
Sensors can be used by others to keep journalists themselves in check
Though sensor journalism is still in an early stage, newsrooms are beginning to navigate the terrain, with some journalists cobbling together their own measuring devices or, more often, using data collected by existing sensors. ProPublica and The Lens have reported on Louisiana’s disappearing coastlines by analyzing satellite imagery of the state’s changing land patterns, while The New York Times has used data collected via satellites to bolster their reporting on conflicts and breaking news events abroad.
Many outlets have taken on environmental projects with help from sensors. USA Today’s investigative unit employed a handheld device that measures soil contamination to undertake a comprehensive examination of the legacy left by lead factories, while WNYC has tackled crowdsourced DIY sensor projects to both predict the arrival of cicadas and measure the effects of heat stress in Harlem. In India, the nonprofit IndiaSpend has teamed up with Twitter to monitor air quality in real time.
“Speeding Cops,” the series that resulted from the Sun Sentinel’s three-month investigation, led to the disciplining of speeding officers and an 84 percent drop in police speeding a year later. It was recognized with a 2013 Public Service Pulitzer. Data automatically collected by sensors provided the backbone of the reporting for the series but the reporters, armed with a Garmin GPS device, traveled 2,700 miles to measure the distances between toll stations.
Thanks to a reader tip, Maines and Kestin knew that SunPass, the state’s prepaid toll program, registered the dates and times when cars passed through tollgates, and they also knew that each state-owned police car was equipped with a special transponder that allowed them to travel Florida’s tollways for free. Tollgates would “read” the transponders, each with a unique ID, and register the time of passage through each toll plaza; that data would then be sent to SunPass so it had a record of vehicles authorized to travel for free.
This information, Maines and Kestin argued, was public record since the government owns the tollways. With some prodding, they convinced SunPass to provide them with about a year’s worth of data—totaling more than a million records. By plugging the SunPass data and the distances between tolls into an algorithm Maines created in Microsoft Access, he was able to produce a list of police officers who drove well above the speed limit. The results were staggering: Maines and Kestin documented nearly 800 officers who in the span of a year drove between 90 and 130 mph on the highways.
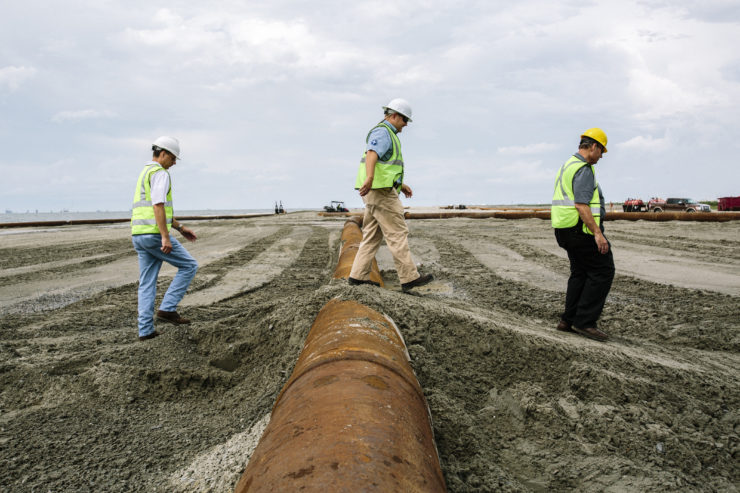
A few hundred miles away from the Florida Turnpike, in Louisiana, journalists took a deep dive into the state’s disappearing coastlines, drawing on a very different kind of sensor: Landsat, the world’s longest-running satellite imagery program. A joint NASA-U.S. Geological Survey initiative that commenced in 1972, it provides journalists with an opportunity to make comparisons and see how natural resources and land use have changed over time.
Landsat data was key to “Losing Ground,” a multimedia investigation into the massive loss of land in southern Louisiana, produced by ProPublica and The Lens, a nonprofit public-interest news outlet based in New Orleans. Historically, land-building sediment deposited by the Mississippi and its tributaries or carried from offshore by storms and high tides ensured that these areas would remain above the Gulf of Mexico. But, as levees were built to prevent floods and canals were dredged for oil and gas extraction, these landscapes no longer received the sediments that once sustained them. Coastal Louisiana was about 25 percent larger in the 1930s than it is now; the USGS estimates that nearly 2,000 square miles of land has disappeared.
To illustrate these facts, ProPublica—with guidance on what areas to focus on from The Lens’ Bob Marshall, who had long covered Louisiana’s coasts and wetlands—combined modern satellite data they processed themselves, USGS interpretations of historic satellite data, and maps and aerial photography that preceded the satellite era. The result is a layered map that allows readers to toggle back and forth through time, watching as land turns into water.
“You could actually see that this land had been disappearing over the course of the decades,” says Brian Jacobs who, while the Knight-Mozilla Open News Fellow at ProPublica, worked on the story with news applications developer Al Shaw. “Bob’s story provided the on-the-ground [aspect of] how this was affecting people. That worked hand-in-hand with these intense graphics that really showed from a bird’s eye view what was changing. Those fed off of each other to give it a little more emotional weight.”
Satellite data is a lot easier to access than it has been in the past. Jacobs and Shaw obtained the Landsat data from free, searchable online catalogs. That said, the project is also a prime example of how reporting on data somebody else collects is not as simple as newbies might hope. The Landsat images, after all, are not typical photos. Instead, what you’re getting is data on the fuller spectrum of light—both visible and invisible—that passes through the atmosphere.
That’s important, because it means the satellites collect information you could never get from a photo, allowing the reporters to offer an unprecedented level of detail about the changes over time. For instance, green leaves reflect more near-infrared light. That information can tell you something about the health of a forest. “By using these two different types of imagery, it allowed us to get better contrast between land and water,” says Jacobs, “that allowed us to visualize this land loss data on top of this other imagery. It made it a lot more obvious what was changing.”
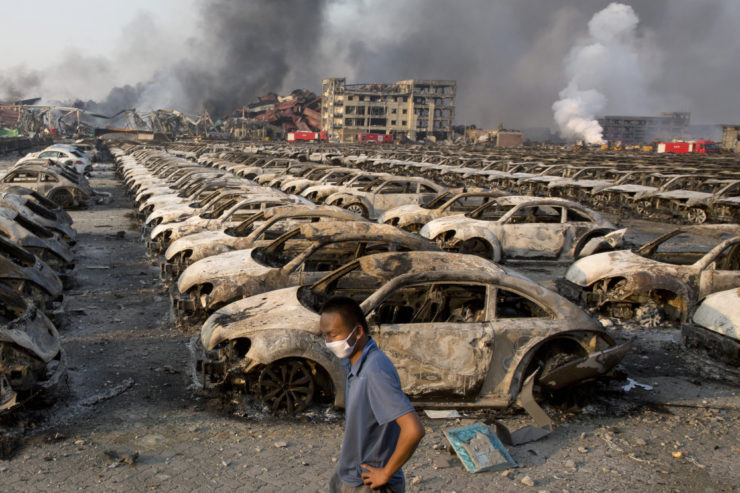
Besides providing a historical view as shown in “Losing Ground,” satellites can also give journalists a look at far-flung breaking news that might otherwise go unreported. When a chemical warehouse in China’s port city of Tianjin exploded in August 2015, satellites gave journalists around the world the ability to see and analyze a site that they would have had trouble accessing any other way.
Satellites captured the flare caused by one of the blasts, which—registering as a magnitude 2.9 earthquake—altogether killed 173 people, injured hundreds of others, and wreaked havoc on industrial and residential buildings miles away. Within hours of the explosion, The New York Times used private satellite images collected by Terra Bella (a Google company formerly known as Skybox Imaging) to show the extent of the damage, publishing before and after imagery of the disaster zone.
That imagery not only illustrated for remote audiences what was going on, but helped the journalists on the ground further their investigation. Andrew Jacobs, a former China correspondent for the Times, had taken a two-hour cab ride to Tianjin from where he was based in Beijing after his editor in New York called in the middle of the night to alert him to the explosion. In the days and weeks that followed, Jacobs and other reporters relied on the satellite imagery gathered by their colleagues back in the U.S. to navigate the port and surrounding areas impacted by the blast.
“It was a very disorienting place. Like everything in China, it’s mega-enormous. There’s usually not many landmarks, and it’s hard to figure out where you are. The Chinese weren’t, obviously, helping us find anything—they’d try to keep you away from things,” says Jacobs. “So [the imagery] definitely helped us find back ways into the explosion area, find ways to get around police, maybe get better vantage points, and understand which residences would be affected based on where they were facing from the explosion.” By examining satellite imagery and public records, the Times determined that the annihilated warehouse was one of many across the country that, in violation of safety regulations, stored toxic chemicals in close proximity to residential areas, schools, and highways.
Satellites can give journalists a look at far-flung breaking news that might otherwise go unreported
For Jacobs, who’s now based on the international desk back in New York, covering the Tianjin incident demonstrated how useful satellite imagery can be in reporting, especially in a country like China, where authorities make it difficult for outsiders to do their jobs and the state media limits coverage and often downplays the magnitude of tragedies. “The local Tianjin media was trying to do a good job—they sent their reporters out there, but then only after a few hours, they got pulled back or their coverage got squelched,” says Jacobs. “In China, [satellite imagery is] very useful since things are intentionally non-transparent.”
At the Times, similar efforts have been applied to projects ranging from assessment of the damage to Gaza’s infrastructure after an outbreak of fighting to a visualization of how ISIS came to control large portions of Syria and Iraq—both stories that journalists wouldn’t have been able to fully report, much less tell, without the use of satellite imagery.
While remote sensing, especially the use of satellite imagery, is probably the most popular way news organizations are currently practicing sensor journalism, reporters can also take an off-the-shelf tool and collect original data themselves. That tool could be something simple, like a thermometer, or a piece of scientific equipment worth thousands of dollars.
The latter is what USA Today investigative journalist Alison Young used to report her team’s “Ghost Factories” series about the health risks posed by more than 400 forgotten lead factory sites. The series prompted the EPA to announce it would reexamine many of the former lead factory sites and launch cleanup efforts where necessary.
Young began the work by digging into reports that hundreds of former lead smelter operations—which, for much of the 20th century, melted scrap products like lead-acid batteries in order to isolate the lead from other compounds—across the U.S. were unrecognized by federal or state authorities. That posed a potentially serious risk to public health since lead dust and other toxic metal particles released into the air during the smelting process can seep into surface soils and remain there long after the majority of smelting operations were shuttered in the 1970s and 1980s. Children playing on grounds befouled with lead slag are especially at risk since inhaling or ingesting even small amounts of contaminated soil or lead dust can result in severe physical and developmental problems; lead toxicity can be fatal.
Young based much of her work on a 2001 research study, conducted by environmental scientist William Eckel, listing 464 lead-smelting sites that appeared to be unknown to the EPA or state regulators. When she joined USA Today’s investigative unit in 2010, she embarked on a nationwide probe of the forgotten sites.
Young relied on an X-Ray Fluorescence (XRF) Analyzer, a hand-held device that can be used to measure the chemical composition of soil. After getting training in the use of the device, she pointed a XRF Analyzer at a soil sample and pulled the trigger. At the time, the XRF devices cost $41,000 each; they negotiated a rental agreement with the manufacturer, Thermo Fisher Scientific. She paid $2,250 per month. The data gathered by the XRF Analyzer—proving that the soil in many of the investigated neighborhoods was indeed contaminated with lead levels well above what the EPA considers safe—was at the crux of “Ghost Factories,” the series resulting from Young’s investigation, but it had little meaning on its own.
“You have to do your gumshoe traditional reporting,” says Young. Long before she tested soil with the XRF Analyzer, she and her team spent months at the Library of Congress, examining historical Sanborn maps, which—originally created for fire insurance liability in U.S. cities—contain a wealth of detailed information about buildings and their surroundings. Along with city directories, phone books, property records, and archival photographs, the maps helped the reporters eliminate some of the sites on Eckel’s list that turned out to be business offices; they narrowed the list down to 230 questionable sites in 25 states. But that was just the beginning.
“Once we got that, we needed to assess which of these might be good candidates to do soil testing at. That involves taking a look at what we could find about the years of operation, how big of a factory it was,” says Young. “Separately, there was a massive FOIA effort that I was doing, that literally was requesting documents from state regulators as well as from the EPA to try to assess, ‘What exactly did you do when Bill Eckel raised the flag about this thing? What did the assessments show?’”
In addition to the EPA action “Ghost Factories” prompted, the project served as an intensive course for Young in how to approach and carry out sensor journalism. “You really need to bulletproof what you’re doing,” she says, “because there will be those who will potentially raise questions about, ‘Who are you as a journalist to be using scientific equipment or scientific methods?’ You want to make sure that you’ve read up on the scientific literature, that you understand how others use the technology, what are the best practices.”
Besides the importance of doing your homework, it is critical that reporters consult with experts to make sure what you’re doing is scientifically valid. On “Ghost Factories,” Young consulted with toxicologist Howard Mielke, one of the world’s experts on lead concentration in soils. Young did her own testing, but still sent some soil samples to Mielke’s labs at Tulane University so he could do independent chemical tests to make sure the XRF Analyzer’s readings were accurate.
USA Today spent thousands of dollars on the research for “Ghost Factories.” Plenty of newsrooms can’t afford that kind of investment. Yet DIY sensor journalism—sensors you build yourself, utilizing prototyping platforms such as Raspberry Pi or Arduino, hobby electronics that are relatively inexpensive—holds promise. “One of the cool things about this entire field is that the price of all this stuff is coming way down,” says John Keefe, who recently joined the Quartz Bot Studio as a developer and app product manager after spending more than 15 years at WNYC. “You can do a lot for under 40 bucks.”
For journalists, these low-cost sensors lend themselves to experimentation in collecting your own data, or even farming data collection out to crowdsourced armies of volunteers. Employing their listeners to tinker with tools and hardware, WNYC launched a handful of crowdsourced projects over the past few years under Keefe’s guidance while he was the senior editor for data news at the station. The first effort involved, of all things, bugs.
Every 17 years, Brood II cicadas appear in swarms across the East Coast, tunneling their way out of the ground in order to lay eggs (making a lot of noise in the process). Knowing that the cicadas were due to appear sometime in spring or early summer of 2013, Keefe saw an opportunity to utilize some of the hardware he had been tinkering with over the previous year.
“When the discussion came up in the newsroom about what we might do around cicadas, I poked around online and wanted to see what we might learn or know about them,” said Keefe. “It turned out that if you know the temperature of the soil eight inches down, you can actually predict pretty closely on what day or what week they’re going to come out,” since cicadas typically emerge when the temperature at that depth reaches 64 degrees.
Keefe wondered if he could build a temperature-sensing device that, if stuck underground, could help predict when the cicadas would arrive. He prototyped a model and tested it in a potted plant in the radio station’s conference room. It worked. Buoyed by the success, he suggested Cicada Tracker, a project that invited WNYC listeners to buy or make their own sensors and report their findings in order to predict when the cicadas were due to appear. The Cicada Tracker received nearly 1,500 temperature readings from listeners, posting a map with the data and recording when cicadas started being seen and heard so audiences could see how accurate predictions were in their area.
WNYC is committed to DIY sensor projects. Last summer, the station partnered with AdaptNY news service and the iSeeChange weather tracker to study the effects of heat stress in Harlem, a neighborhood that is considered to be particularly “heat sensitive” due to the high concentration of heat-trapping asphalt, brick, and concrete infrastructure. For the Harlem Heat Project, WNYC built thumb-sized sensors that recorded the temperature, humidity, and the time every 15 minutes. Volunteers from a local community organization installed the sensors in 30 non-air conditioned apartments (since indoor temperatures are often even higher than outdoors) of friends and relatives around the neighborhood, and will return twice a week to collect data. This information was intertwined with stories about how people cope with the heat and the public health issue related to heat-related stress.
At the end of the summer, WNYC and their partners used the data to help them brainstorm ways to mitigate the risks of extreme heat in inner cities. One proposal was to expand the sensor network to create “personalized heat alerts,” giving sensors to any residents who want them and creating a wireless network so that, when the heat in an apartment rose above a certain temperature, neighbors or relatives would be alerted to check on the resident—something that would be particularly useful for elderly individuals.
Low-cost sensors lend themselves to experimentation
Sensors—even DIY sensors—can test air and water quality, or collect data on radiation levels, industrial pollution, and climate change. One such example is #Breathe, a public service project to monitor air quality in cities across India. An initiative of nonprofit data journalism outlet IndiaSpend and Twitter India, the project launched in 2015 with a network of low-cost monitoring devices that allow citizens in a handful of cities to get instant air quality updates by simply tweeting ‘#Breathe’ followed by their city. Those who do receive an auto-response tweet that, in the form of an infographic, includes various measurements of air quality and the possible impact current levels will have on health. The data is also visualized on a real-time dashboard on IndiaSpend’s website, which displays a map with air quality index values for each location as well as an interface allowing users to look at historical data to compare air quality changes over different time periods..
Sensor journalism in its many forms raises numerous ethical questions, privacy being foremost among them. Minimization is also key when it comes to data collection via sensors. “It’s a very important concept—that we’re not just broadly going and gathering as much data as we can without a specific purpose,” says Culver. “We should have reporting questions in mind, and then we should go out and sense data to help us in answering those questions. It shouldn’t be a surveillance-type sweep. It should be very specified and minimized.”
Our modern world is a sensed world. We are tracked by stores, by governments, by private institutions, by our neighbors. The ethics of sensors might not necessarily drive journalists to different choices, but it could drive them to find new ways of making those choices make sense to people who are not journalists. And that’s an important part of building public trust in journalism as a whole.