In recent years, journalism in Ukraine and other post-Soviet states has been in flux, with editorial independence reliant on foreign entities, funding in constant deficit, and press freedoms wavering. Now, as Russia’s war in Ukraine continues to drag on, the work of journalists in the country has become more urgent — and dangerous — than ever.
As civilian deaths mount, journalists, too, have lost their lives reporting on the war’s horrors. Nieman Reports takes a look at how Ukrainian journalists are reporting on the war in their home, the costs of reporting accurately on the invasion, and the growing threats to press freedom under Putin.
In the summer of 2017, Susan Potter of The Atlanta Journal-Constitution wrote the kind of column that no editor wants to pen.
“Our poll of the 6th Congressional District race, conducted two weeks before the June 20 runoff, missed the mark. There’s just no getting around it,” Potter wrote. “It showed Democrat Jon Ossoff with a 7-point lead among likely voters, with a margin of error of 4 percentage points. Republican Karen Handel ended up winning by 4 points.”
Potter, the Journal-Constitution’s senior editor for state government and politics, wrote that the sample of nearly 800 likely voters didn’t have enough young, female, or minority respondents. The pollster, Abt Associates, overweighted the responses from those groups to make up for it. “Typically, such adjustments don’t have a big impact on the final results,” Potter explained. “But in this case, the demographic groups adjusted for tended to vote disproportionately for the Democrat.”
But rather than shrink back after the missed call in the Ossoff-Handel faceoff — which at the time was the most expensive House race in U.S. history — the paper continues to commission polls as a tool to inform its coverage. “I have to keep an eye on what we’re learning about polling, [and] we will have to keep evaluating our methodology and, eventually, whether we keep on doing it,” Potter explains. “But right now, it remains the best tool we have for getting some picture of public sentiment.”
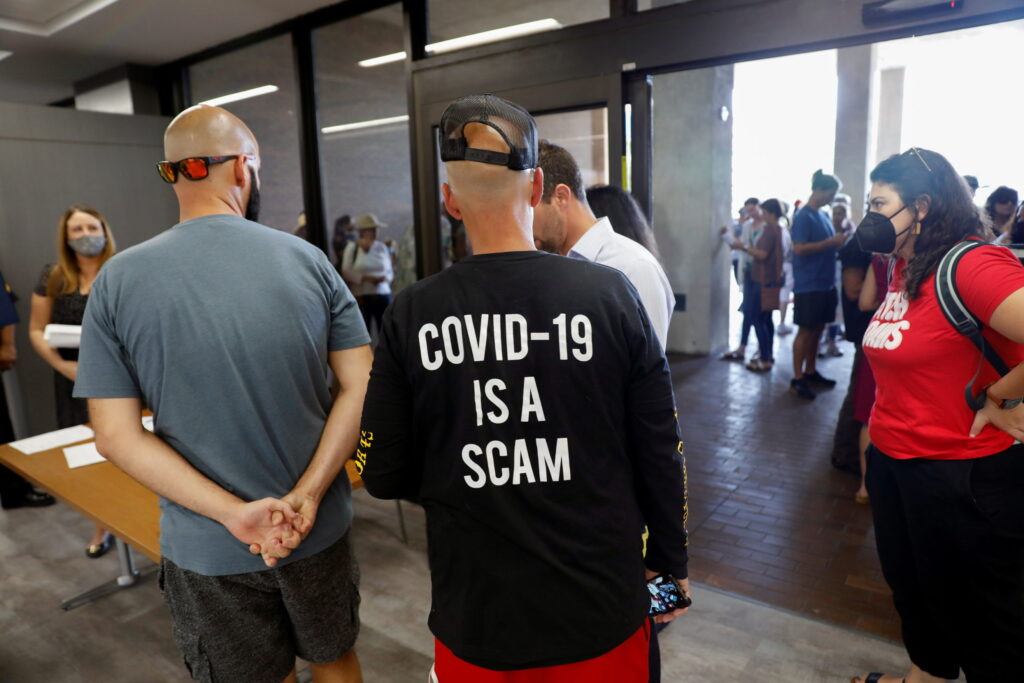
The Atlanta paper’s bad experience involved a single race in a single congressional district, but since the 2016 presidential election, news organizations across the country have been forced to reckon with both the inaccuracies of political polling as well as the misguided editorial choices that created an aura of invincibility around Hillary Clinton’s campaign. There were a variety of problems with polls that media outlets used (and commissioned) while covering the election: Some surveys did not weight the responses properly to ensure the polls properly reflected the electorate. Some were affected by “nonresponse bias,” which occurs when the population that doesn’t respond to a poll is substantially different than the one that does. At the same time, news organizations often failed to give context to survey data, playing up single polls in an attempt to inject excitement into their horserace coverage. This dynamic has led many Americans to doubt the polling reported on in the media, and research suggests that people are more inclined to believe polls that tell them what they want to hear.
The Capitol insurrection on Jan. 6, 2021 was “one of the ultimate evidence points of what happens when people’s mistrust in polling and election results and the reporting around that gets weaponized,” says Margaret Talev, managing editor for politics at Axios. When polling data is off — as in 2020 when polling indicated that Joe Biden had a larger lead than what he wound up winning by — and coverage amplifies it, that dynamic can lead to distrust, especially in such a hyperpartisan environment. “It’s added an additional layer [of] responsibility [to] the way we cover data and elections,” Talev explains.
As news outlets prepare for the 2022 midterms and beyond, many are grappling with how to best cover polls as part of an accurate and balanced news diet
When handled with care, surveys can enhance coverage of not only elections, but many other issues, from the Covid-19 response to international relations to abortion. They can give insights into how attitudes on certain issues change over time or explain how our government fails to deliver key reforms despite overwhelming public support. (For example, 84 percent of Americans support background checks for gun purchases, but Congress has made little progress in advancing legislation.) “Voters in federal elections only get to weigh in every two years as to who represents them in Washington and what issues they want them to focus on,” says Steven Shepard, senior campaigns and elections editor and chief polling analyst for Politico. “Polling is a way to get the voice of the people in front of their leaders more frequently than that.”
As news outlets prepare for the 2022 midterms and beyond, many are grappling with how to best cover polls as part of an accurate and balanced news diet. The question remains: How can we get the most useful information out of polling — and convey that information well — while avoiding pitfalls of small sample sizes, leading questions, and the narrowness of horserace coverage?
To understand the path forward, it’s important to look back at the 2016 and 2020 election cycles.
A day after the 2016 election, Reuters reported in one analysis after the dust settled, “pollsters and statisticians gave Hillary Clinton odds of between 75 and 99 percent of winning the U.S. presidential election.” Clinton did beat Trump in the popular vote, but some state-level polling and projections used by aggregators were off. The American Association for Public Opinion Research (AAPOR)’s review of the 2016 election found a variety of factors likely led to the underestimation of support for a Donald Trump presidency. That included a large change in vote preference in the final days of the race. Pollsters also failed to adjust for an overrepresentation of more educated voters, particularly in state-level polls, AAPOR found. People with more formal education were more likely to support Hillary Clinton — and highly educated people were also more likely to agree to participate in surveys.
That same post-mortem also stressed the difference between polls and forecasts. “Pollsters and astute poll reporters are often careful to describe their findings as a snapshot in time, measuring public opinion when they are fielded,” the study noted. “Forecasting models do something different — they attempt to predict a future event. As the 2016 election proved, that can be a fraught exercise, and the net benefit to the country is unclear.”
Heading into 2020, both pollsters and news outlets promised to do better. Groups like Hart Research, a pollster for NBC News/Wall Street Journal research, changed weighting by education as early as 2016, while Ipsos and Pew also moved to adjust their education weighting within racial categories. Other considerations included paying increased attention to where they found survey respondents — urban vs. rural areas, for example — and to reaching people by mobile phone (including texting) versus landline. While most national polls correctly estimated Joe Biden would get more votes than Trump, Biden’s ultimate margin of victory wasn’t as big as the numbers had indicated. “The polls overstated the Biden-Trump margin by 3.9 points in the national popular vote and by 4.3 points in state-level presidential poll,” AAPOR’s analysis of pre-2020 election surveys found.
Looking ahead, pollsters will need to recognize the importance of reaching people in different ways, says Politico’s Shepard. This means continuing the evolution of polls to include more cell phone interviews and branching out to email, text message, or regular mail. Other analyses have pointed to the need to consider educational attainment as a bigger part of the equation, along with attributes such as age, gender, and geographic location.
Pew, a formidable name in polling, has already announced substantial changes to its survey system, including altering the weighting of its polls to better reflect America’s partisan balance, retiring thousands of “demographically overrepresented” panelists and recruiting new ones, updating its recruitment materials, and adding respondents who prefer to answer poll questions by mail.
These adjustments could help address some of the fault lines of polling for better accuracy, but the press will still have lots to be cautious about — and will need to alter coverage practices — no matter how polls are conducted.
When it comes to the business of journalism, the amount of time spent on poll coverage, even with its perils, makes sense.
“Journalists are taught that what is [more] dramatic makes for better news, because it incentivizes the audiences to tune in,” says Kathleen Searles, associate professor of political communication at Louisiana State University. If drama’s what sells, the “lowest-cost, lowest-hanging fruit way to do that is to use polls, because polls are high in supply, the audience demands it, [and they] can be packaged for television news in a way that has more visual appeal and perhaps more interest for a lot of political junkies, which are the kind of people that like to tune into news anyway,” she says.
In a 2016 paper, Searles and her coauthors dug into TV news coverage of the 2008 presidential race and found that although Democrat Barack Obama was pretty consistently outperforming John McCain in polls, “if you were just to take news coverage at stock value, you would be well inclined to walk away thinking that there was [a] very close race.” (It was not: Obama handily defeated McCain 52.9% to 45.7%.)
Why? Media gatekeepers made editorial choices about which polls to play up and which to disregard. Some of these choices, the study found, aligned with the outlet’s ideological slant or favored polls that showed “significant changes” in the standing of the competitors. “If media is the conduit by which the public gauges the state of the race, then we are being misled,” Searles and her collaborators wrote.
Addressing the much-critiqued poll-driven horserace mentality is key to fixing this. As Harvard’s Kennedy School has noted, horserace coverage has been linked to distrust in public officials and news outlets, to hurting women candidates who focus more on policy issues, and to sidelining third-party candidates via coverage of politics through a two-party lens. But it’s not about stopping the coverage. It’s about adding context. Reporting on real neck-and-neck results, says Joshua Dyck, professor of political science and director of the Center for Public Opinion at the University of Massachusetts Lowell, may be of real public service: “It can raise the stakes, which increases the probability that those voters at the margins turn out, and I think that that can be a positive for democracy.”
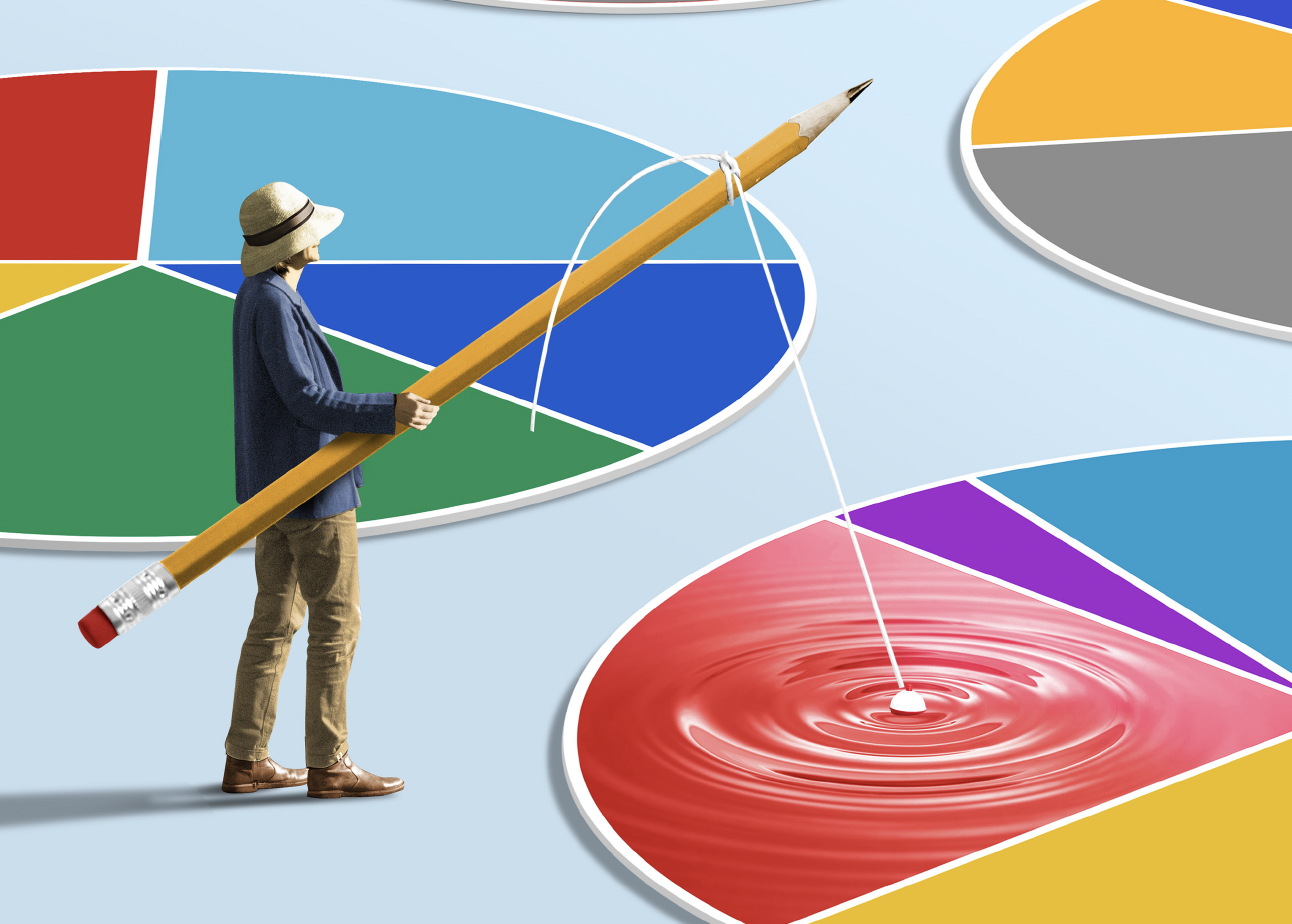
Speaking directly to voters at home and on the trail provides color and context, but there’s no getting around the fact that polls cover a broader swath of public sentiment than reporters can ever reach through anecdotes
Speaking directly to voters at home and on the trail provides color and context, but there’s no getting around the fact that polls cover a broader swath of public sentiment than reporters can ever reach through anecdotes, no matter how many they gather and how fastidiously.
Sometimes, as hard as it may be, journalists need to take a step back from covering individual polls, says Amy Walter, publisher and editor-in-chief of the Cook Political Report with Amy Walter. Take, for example, the stories about President Biden’s 33% approval rating in a mid-January Quinnipiac poll, which got widespread coverage. “Instead of breathlessly covering [this as], ‘Oh my God, Quinnipiac shows him at 33%,’” she advises, media outlets can say, “’Well, let’s wait and see, as other polls come in, where this fits into the trend line.’ Is that really where he is, or is [that] one poll? Put it [into] context.”
Putting too much focus on outlier polls can give the public a skewed version of the overall trajectory of an issue or race and create a false impression of a momentum shift that candidates or advocacy groups can use to raise funds and recruit — or as Pacific Standard once put it, allowing polls to create changes “instead of detecting them.”
The long-term approach can be particularly revealing on social-issue and policy polls. Talev points to Axios’ ongoing survey research on Covid-19, done in conjunction with Ipsos, that’s been cited by research published in the journal Nature for its accuracy. Through sustained polling, Axios/Ipsos has been able to gather both anecdotes and data-driven insights about Americans’ views on the coronavirus crisis and vaccinations. The polling has investigated how news consumption habits relate to infection rates and willingness to get vaccinated and studied attitudes about in-person versus remote schooling.
“We do see value in the trends that polls reveal and in the crosstabs for a lot of responses to big questions of our day,” she says. “A poll is only as good as the moment in which you ask it, the sample, and the model for your sample. And so multiple waves of a poll, being able to look back at that pattern, that duration, tells you much more than a snapshot in time does, and that’s been the real value of that survey to us.”
Experts on conducting, analyzing, and covering polls caution that it’s vital for the press to understand and convey exactly what polls tell us — and what they do not or cannot.
Polls don’t tell us who’s actually going to win. (Anyone who needs a reminder on this can look to the AP Stylebook, updated in 2018 to advise specifically against making a single political horserace poll the subject or headline of a whole news story.) Presenting polls as oracles is a recipe for heartburn — especially as even the most rigorous pollsters have run into new challenges in recent cycles.
“For many pollsters, response rates have dropped into the single digits, which means that pollsters have difficulty generating representative samples and it is hard to gauge turnout at a time when there have been substantial fluctuations in who turns out to vote,” says Darrell West, vice president of governance studies at the Brookings Institution.
It’s also important to remember that polls don’t “tell you [information] beyond exactly what the question asks,” says David Moore, senior fellow at the University of New Hampshire’s Carsey School of Public Policy. “You can go ahead and try to ascribe to public opinion [polls] the reasons why people hold [certain beliefs], but that’s speculative.”
There is also the danger that pollsters will still attempt to extract an opinion even if respondents know little or nothing about an issue, candidate, or policy. They do this by providing a little information to the respondent. “It’s just the refusal of the polling industry to try to acknowledge that there are significant portions of the public who are unengaged in any issues,” adds Moore. “Instead, they try to make it appear as though, you know, essentially we have a fully informed and fully opinionated public.”
After Supreme Court Justice Stephen Breyer announced in January that he’d retire at the end of the court’s current term, Moore said he was ready to see a spate of polls asking the public what they thought of President Biden’s eventual nominee — who would in all likelihood be a jurist most people simply didn’t know. “It’s going to be creating the illusion of public opinion. There will not be a sufficient number of people who have any idea about the new nominee to make a sober judgment,” says Moore. “Why even do a poll like that?”
True to Moore’s prediction, within days of Biden’s announcement of his Supreme Court pick, at least four polls asked Americans to evaluate Biden’s choice, he notes. Two of these, one by The Economist/YouGov and another by Quinnipiac, found about seven in ten Americans with an opinion about Judge Ketanji Brown Jackson. “That would be an amazing degree of recognition,” Moore says, “if the polls bore any semblance to reality. But they don’t.”
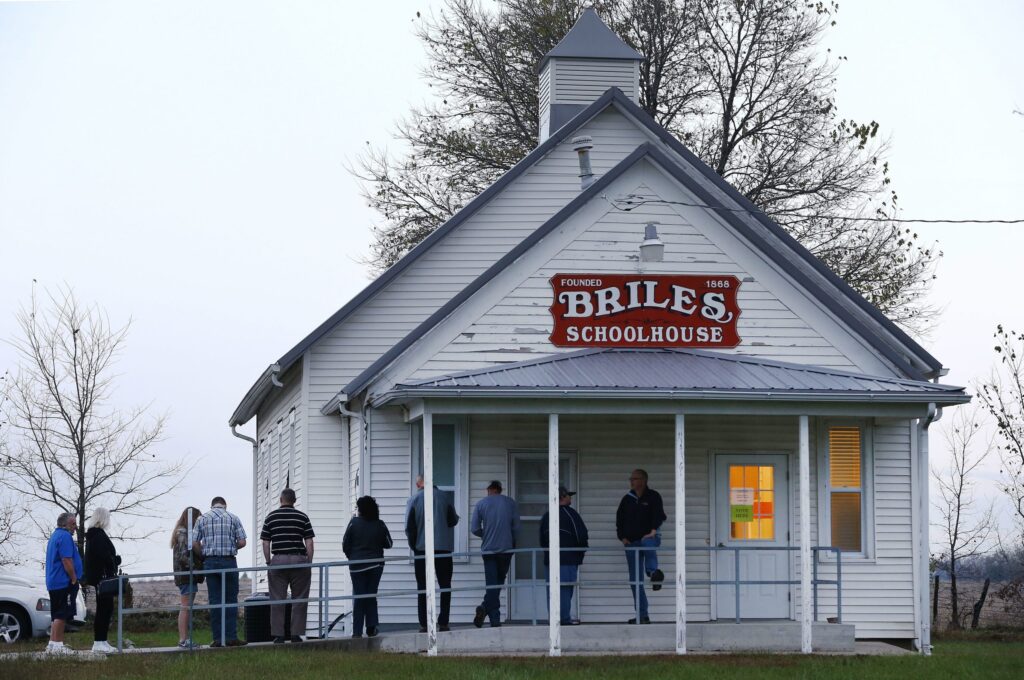
One of the biggest problems with horserace election polling is that it’s one of the few, if not the only, kinds of surveys that attempts to capture the views of a population that does not yet exist: Voters in a particular election.
“There are literally hundreds of thousands of well-intentioned Americans that intend to vote and say that they’re going to vote on a survey and then don’t show up — and vice versa,” says David Dutwin, a senior vice president at NORC at the University of Chicago, a non-partisan research group that works with the Associated Press. “Election polling, for that reason, is harder than any other type of research out there.”
Internal polls from campaigns and those conducted by partisan or affiliated researchers should be reviewed with wariness. Campaigns release those because they want the public — or their opponents — to see them, and not necessarily because they accurately reflect the state of the race.
Media outlets make some exceptions depending on context and format. Politico, for example, ran a November 2021 story about internal GOP polling showing Republicans with a potential advantage in the 2022 midterms. The piece clearly identified the poll as partisan and noted that it fell largely in line with public polling. In other cases, outlets like The Atlanta Journal-Constitution — which now conducts polls with the University of Georgia instead of a private firm — will cite an internal poll in a political newsletter or blog format instead of a standard, general-consumption news story. Those mentions come with cautionary language and are meant to help tell a larger story about a campaign’s operations, not to be taken as gospel.
But it’s not just political polling reporters have to look out for. “Polls that are conducted by companies that reinforce their brand identities are things you should just toss in the garbage,” says Philip Bump, national correspondent for The Washington Post. “It’s just an ad, and we should absolutely not be in the business of just running people’s ads for them.” Companies make supposedly data-based claims all the time, but obviously, it’s to their advantage to frame the data in the most profitable way. In 2007, for example, the U.K.’s Advertising Standards Authority ordered Colgate-Palmolive to stop claiming four out of five dentists recommended its toothpaste, because the survey actually allowed the participants to recommend multiple brands.
Other things to avoid include self-selecting polls, where the response group is not a representative sample of a larger population, but entirely composed of people who felt like taking a poll — sometimes repeatedly. Think of television talent shows like “The Voice,” where people can vote up to 10 times, or polls on the web, where anyone who wants to vote can (and get like-minded friends to do the same) — which is how the R.R.S. Sir David Attenborough was almost christened Boaty McBoatface by internet voters.
“There are ways in which you would vet a source for a story that you should similarly vet a poll,” advises Bump. “If there’s something about it that seems iffy, dig a little further.”
Taking to heart the lessons of 2016 and 2020 is one thing. But reporters also shouldn’t be overcautious to the point of being factually inaccurate, warns Dyck, from UMass Lowell.
Take a contest between two candidates. There’s a two-point spread and the poll’s margin of error is plus or minus three percent. Because the spread is within the margin, “That is not a statistically significant finding,” says Dyck. In this situation, reporters often roll out “my least favorite press word in all of coverage, which is that the poll reveals a ‘statistical tie.’ Okay, there is no such thing as a ‘statistical tie.’ … Probabilistically, in the poll, Candidate X actually is ahead of Candidate Y — just not at a scientific level of certainty.”
So, what does the reporter or headline writer do? Simple language can be most accurate: “A close poll reveals a close race,” Dyck says. Transparency also matters a lot once the decision’s made to cover a poll. Experts consistently recommend at the very least disclosing who conducted the poll, the dates the polling took place, the margin of error, the number of respondents, and methodology.
Within specific polls, it’s also vital to avoid overblowing from findings within the crosstabs, which break down responses to poll questions by categories such as age, gender, and ethnicity. Once the poll breaks down the entire sample group into smaller categories, the margin of error goes up. Walter says her personal rule of thumb is to disregard groupings that include fewer than 100 respondents, because “the margin of error is going to be out of control.”
Polling aggregators combine survey data — often through averaging individual polls or regression-based analyses — to give a broader picture about the state of political race or public sentiment about the direction of country. RealClearPolitics and Electoral-vote.com — debuting in 2000 and 2004 respectively — are among the earliest aggregators to gain traction. They were soon followed by what would become a major player in the aggregator landscape: FiveThirtyEight, which Nate Silver launched in 2008 and eventually became part of The New York Times and later ABC News. FiveThirtyEight’s accuracy in predicting the outcomes of the 2008 and 2012 elections created “the golden age of poll aggregation,” as Vox once called it.
“I think aggregators can add a lot of context [and] also make for more responsible reporting at the end of the day,” says FiveThirtyEight elections analyst Geoffrey Skelley. Aggregators show trends not only across the lifespan of something like an election cycle, but across many different polling sources, with extra features like ratings for the quality of the pollsters included in its aggregates and detailed explanations of its process and methods.
Still, Skelley notes that aggregators rely on individual polls, all of which have some level of error built into them. “There’s always going to be a confidence interval around your estimate based on the polling you’re looking at because of just the fact that polls can’t sample everyone, so it is not possible to get a perfect estimate,” he says.

NORC’s Dutwin, who’s also a former president of AAPOR, praises aspects of what FiveThirtyEight and RealClearPolitics do and the sophistication of their models, but says there’s often “an assumption by journalists that they have to be right.” For example, he asks, what if there’s a systemic issue with many of the polls that go into the average for a certain race or cycle, such as non-response error that doesn’t fully account for Trump supporters?
“The aggregators aggregate under the assumption that essentially error [across polls] is random, too, that it goes both ways. The reality is that if errors are only going in one direction, then the aggregation isn’t really making anything more accurate,” he says. Still, he says, the average the aggregator spits out “is a number that then journalists take to press as a golden number, when in reality, it’s no different than the number that most single polls are getting.”
In short, as AAPOR puts it, “poll aggregators are only as good as the polls themselves.” In 2016, Trump ultimately won the presidency with 306 electoral votes to Clinton’s 228. Plenty of pollsters, aggregators, and media outlets got it wrong: FiveThirtyEight went with Clinton 302/Trump 235; the Associated Press calculated it as Clinton 274/Trump 190, leaving out from its total a handful of states that were too close to call.
Transparency around how these polling aggregators work — and explicitly about their limitations — help audiences better interpret the results. In unveiling its first-ever American election forecast for the 2020 election, The Economist provided readers with highly detailed information about how it gathered data and who it worked with on the forecast, as well as the potential weaknesses of its system. The outlet, which gave a 97% certainty that Biden would win, even published source code for a section of the model it used, opening its information and the outlet itself to further scrutiny not only from readers, but from data scientists.
In fact, whether outlets commission or conduct their own polls or just cover what’s out there, experts say creating and sharing standards on how they develop and cover polls or present forecasts can build audience trust. ABC News, for example, has a detailed methodology page for the survey it conducts with The Washington Post, written by its former director of polling Gary Langer (see “Serious Problems Demand Serious Data”). The explanation gets into detail as granular as the number of phone interviews conducted for different states by landline and cell.
Beyond creating standards, some news outlets are reconfiguring how they handle polls.
Heading into 2022, NBC is “doing fewer polls but deeper dives and larger samples,” says Chuck Todd, the network’s political director. “We know that the demographics are the story of our politics, whether looking at a county level or nationally,” he says. “We believe we have a great sense of what the American electorate actually looks like so if we can get bigger samples, our demographic dives will give us great insight in just about any state or congressional district.”
No matter how many improvements are made to polling, polls aren’t a crystal ball, and they can’t tell the whole story
CNN Polling Director Jennifer Agiesta has written that the network will debut a new methodology for its public opinion surveys. The network plans to include “online and telephone interviews, allowing respondents to participate in whichever way is more comfortable for them, and will use different methods for measuring long-term trends and for reactions to breaking news,” according to Agiesta. She also says CNN and partner SSRS would conduct polls with a larger sample size and longer field period than in past news polls, selecting respondents randomly by address and contacting them initially by mail, not phone.
No matter how many improvements are made to polling, polls aren’t a crystal ball, and they can’t tell the whole story. It’s key to remember that beyond how polls are conducted, interpreted, and packaged, they can only tell us so much, and using the information they provide should be weighted the way a reporter would weigh using a quote or other material gathered while telling a full, rich, nuanced story.
“A lot of people on a daily basis don’t have the time or interest to even engage in politics. If you’re randomly calling them and [saying], ‘Tell me all your opinions about politics,’ you may actually be getting opinions that aren’t deeply held,” says LSU’s Searles. “In the past, academics have interpreted [the finding] of opinions that fluctuate [as] evidence that the public is stupid — but really what it’s evidence of is that the public just doesn’t walk around thinking about their public opinions all day.”