James T. Hamilton’s article in the spring issue of Nieman Reports about making sense of the U.S. Environmental Protection Agency’s Toxics Release RELATED WEB LINK
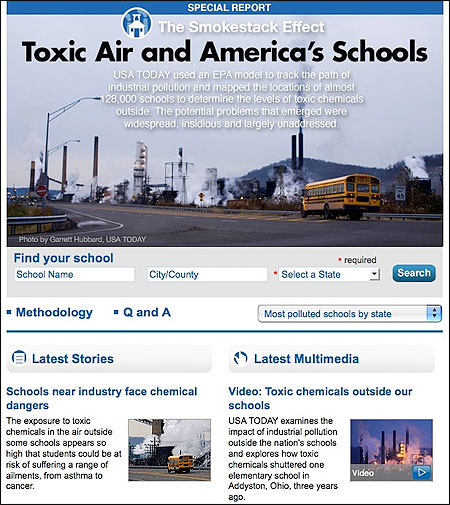
“The Smokestack Effect: Toxic Air and America’s Schools”
- www.usatoday.comeInventory (TRI) data argued for precisely the sort of work USA Today published last year in “The Smokestack Effect: Toxic Air and America’s Schools.” This project exemplified the type of journalism Hamilton advocates when he suggests that TRI should be used for “watchdog articles … written by algorithm in a way that would allow readers to see a customized, personalized article about how a policy problem is playing out in their neighborhood, block or lives.”
In September, Morrison and Heath continued this investigative series for USA Today with "Testing for Toxics at Schools Sparks Questions, Lawsuits." About eight months before our project was published, we’d begun to consider ways to give the TRI meaning. We learned that researchers at the University of Massachusetts Amherst had acquired the microdata for an EPA computer simulation called Risk-Screening Environmental Indicators (RSEI). It uses air dispersion modeling and compares the dangers of one chemical to another as a way to give meaning to the TRI data. The microdata enabled us to use pollution emissions reports, submitted to the EPA as part of the TRI program, to assess the predicted concentrations of hundreds of chemicals in any square kilometer in the country. Simultaneously, we began gathering data to map the locations of almost 128,000 public, private and parochial schools. We obtained the locations from more than two-dozen sources to ensure that the database was as complete and current as possible.
We focused on the locations of schools because children are as much as 10 times more susceptible than adults to the dangers of toxic chemicals. Pinpointing where they gather each day seemed appropriate, and the data we used to determine which schools were in toxic hot spots were based on 2005 TRI reports. (This was the most recent data on industrial pollution that the EPA had modeled.)
The RSEI model we used divided the nation into a grid with each cell measuring one square kilometer. Then it calculated how much of each chemical released by each facility is likely to end up in the air in each cell. Those concentrations were then weighted, based on how much harm the EPA determined is likely to be caused by each chemical. In short: For each square kilometer, the model produces an estimate of which chemicals were in the air, where those chemicals came from, and how harmful they might be.
We spent months refining our analysis—and understanding its limitations. Computer models rest on sets of assumptions, and RSEI is no different. Because of those limitations, the EPA has balked at using the model to determine the health risks at any given location. Instead, it said, the model was meant as a screening tool—a way to rank one location against another to determine which area might demand further scrutiny. Some researchers have tried to use RSEI to calculate the odds that exposure to air pollution will cause cancer. Mathematically, that’s not hard to do. The government has a standard formula it uses to determine how much your risk of contracting cancer goes up based on exposure to various levels of toxic chemicals. But after much discussion, we opted against that approach. Instead, we developed what’s called a “work-around,” using the case of an Ohio school that had been shut down in 2005.
That school, Meredith Hitchens Elementary in Addyston, Ohio, sits across the street from a plastics plant. After residents complained, the Ohio EPA put an air monitor on the school’s roof and took samples for seven months to determine the health risks there. Their results were stunning: Levels of carcinogens in the air were 50 times higher than what the state considers acceptable. The school district closed Hitchens immediately. So we used Hitchens as a benchmark. The monitoring done by the state EPA there—and the risk assessment that its monitoring established—became a means of using RSEI to identify locations where the relative risks to children appeared the same or greater than at Hitchens.
Using RSEI in just the manner the EPA intended, we found 435 schools that ranked worse than Hitchens did. In other words, the air appeared to be more toxic outside 435 schools than it was at a school that had been shuttered. Senator Barbara Boxer, who chairs the Environment and Public Works committee, described our findings “a shocking story of child neglect.”
We listed all 435 schools in print. But we also published an online database to enable users to look up any school in the country. The database—which became the backbone of our reporting—has drawn about 1.7 million page views since we made it available on December 8, 2008. It empowers parents to learn about the types and sources of chemicals that might be in the air near their child’s school.
We weren’t satisfied with simply modeling pollution. The computer simulation was meant as a screening tool—and so that’s how we used it. That’s why we partnered with Johns Hopkins University’s Bloomberg School of Public Health and the University of Maryland to monitor the air outside almost 100 schools. Reporters and editors were trained to use a variety of equipment—from pumps to metals filters—and scientists from the universities developed the protocol we used, analyzed the samples, and interpreted the results. The results showed elevated levels of dangerous chemicals in the air outside about two-thirds of the schools.
The response to our work has been sweeping and dramatic. Hundreds of media outlets localized our stories or used our database to do similar reporting about schools in their area. One advocacy group tracked about 8,000 letters to Congress from parents and others in response to our stories. School districts from California to North Carolina called in regulators to begin long-term air monitoring after seeing the results of air samples taken by USA Today.
Earlier this year, the EPA launched a $2.25 million initiative to monitor air quality outside 62 schools in 22 states. “Your stories raised important questions that merit investigation, and that’s what we’re doing,” EPA administrator Lisa Jackson explained. “We want parents to know that the places their children live, play and learn are safe.”
Blake Morrison is an investigative reporter and the deputy enterprise editor at USA Today. Brad Heath is a national reporter at USA Today, where he specializes in data-driven enterprise.
