
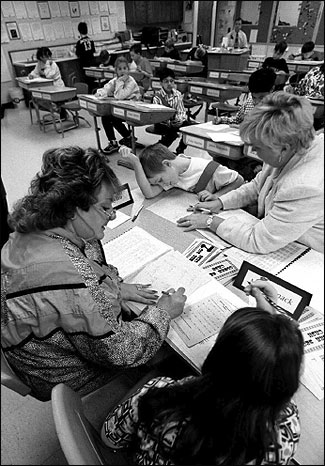
Parents assist children in a fourth grade math class. Photo by Bill Batson, The Omaha World-Herald.
[This article originally appeared in the Spring 1999 issue of Nieman Reports.]
For at least a decade before the Omaha World-Herald published its five-part series “The Learning Gap,” we had been searching for ways to provide parents and the public with a meaningful understanding of how students’ scores on standardized tests were connected with what was actually happening in our schools.
Before we found a way to do this, the Omaha School District—the state’s largest with about 44,000 students— released only subject scores on the California Achievement Test (CAT) for the district as a whole. Those scores didn’t tell the public anything about the performance of individual schools.
“We would compare them to the previous year and to the national norm,” said World-Herald Executive Editor Larry King. “The only analysis we did was ‘Is it better or worse than the year before and the year before that?’ Those trend lines tended to go up and down, up and down. It was hard to make sense of what it meant.”
The public, including parents, had no idea whether some schools were performing as well as others on the tests. They could not compare how math scores in a math/science magnet school, for example, compared to math scores in other schools. And, in a district desegregated through busing, they did not know how scores of schools with busing programs compared with the scores of neighborhood schools that did not have busing.
Editors and reporters asked for more specifics, and the district began releasing scores by school and by grade. But when in the early 1990’s we requested the CAT scores by race there was, as King described it, “a great reluctance.”
In 1995, a management restructuring left Mike Finney, the newspaper’s Executive Editor, in charge of the day-to-day operation of the newsroom. A former high school English teacher, Finney had a great interest in education issues. He also had been a deputy managing editor at the Minneapolis Star Tribune, where reporters were conducting their own computer-assisted data analysis as a way of providing more in-depth reporting. Finney wanted the Omaha public schools to give us the CAT score data so we could conduct our own analysis of it.
Photo by Kiley Christian Cruse, The Omaha World-Herald.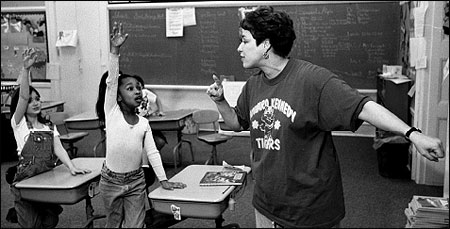
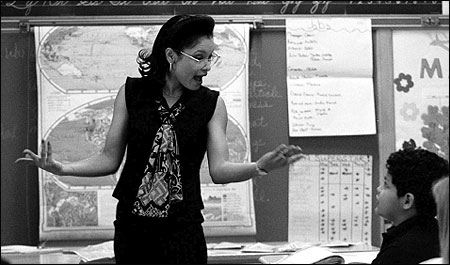
Photo by Bill Batson.
“This was important information that every parent, every teacher and, in fact, every student ought to have access to,” said Finney, who now is President and CEO of World Media Co., an Internet company owned by the World-Herald. “In knowing exactly what is going on, we have the best chance of making the decisions we need and the public policies we need to make the kind of schools we want.”
Despite the logic of our argument and the fact that the scores are public record, getting this information proved difficult. In 1996, after repeated requests, we threatened to sue, and the district finally agreed to release the data. We received scores for nearly 70,000 students who were given the test between 1992 and 1996. The data did not contain students’ names, but it did identify the grade, school, gender, race and home ZIP code for each student, as well as whether the student received free or reduced-price lunch—an indicator of poverty.
After much deliberation about how best to examine the scores, we decided to limit our initial study to the district’s 58 elementary schools and to use a multiple regression analysis. That analytical technique is a statistical procedure that can be used to explain the differences among data, in this case differences among the CAT scores. The regression procedure calculated what the CAT scores were predicted to be, taking into account socioeconomic information about the students and the neighborhoods in which they lived.
Once we had this information about predicted scores, we could look at how schools actually performed and compare these two measures. Such a comparison had the potential to offer insights about student and school performance that had never been made available before to parents and the general public. The school district had been doing a similar regression analysis for the past several years to assess the performance of its schools. But it would not release its results, even to members of the school board.

Photos by Bill Batson, The Omaha World-Herald.
Our analysis showed that in a third of the schools, the gap between actual and predicted scores was statistically significant. In both affluent and low-income areas, some schools scored significantly lower than the statistical model predicted while some scored significantly higher. When we showed the school district the results of our regression analysis, officials said their results were nearly identical. Only a few schools ranked differently. Nevertheless, the district told principals and teachers that the newspaper’ s approach was irresponsible.
“They were contending to their own staff that we were not to be trusted with this,” said Paul Goodsell, a lead reporter for the CAT scores project. After our regression analysis was completed, we knew there were significant differences between predicted and actual performance at certain schools. What we didn’t know were the reasons why. To learn more, we needed to do some old-fashioned, on-site reporting. Using our data, we chose five pairs of schools to visit. Each pair had student bodies with similar demographics, but one school had CAT scores significantly higher than its predicted scores and one had CAT scores significantly lower. Each of five reporters took one pair in order to see any differences in how the schools operated.
For two weeks, this team of reporters spent every day observing in classrooms and interviewing teachers, principals, parents, students and others. Some evenings, we would attend after school functions. At the end of most days, our reporting team would meet and exchange information. As the days passed, we began to see patterns emerge from our observations. Schools scoring better than predicted had these things in common:
- Experienced and creative teaching staffs who stayed at the same school for long periods of time
- Effective classroom and school discipline
- Substantial parent and community involvement in the school
- The ability to recognize and address shortcomings in the school.
These patterns provided us with daily themes for our series that appeared over five days in April 1997.
Since that series ran, the Omaha school district has routinely released the results of its own regression analysis and continues to provide us with student-level scores. That has allowed us to do other education stories prompted by our analysis of data, such as one that showed a federally funded program to improve math and science skills among minorities was having a positive effect. We also have done our own analysis of standardized test scores for other school districts in the region and published those results.
While he can’t place a dollar figure on it, Finney said the newspaper’s investment in the CAT scores series was considerable because the reporters needed to be trained properly in how to do complex analysis of data and statistical software had to be purchased. Most of the money went into the hiring of two consultants to help us learn these new computer-assisted reporting skills and into the staff time it then took to properly analyze the data, interpret the findings, and decide on how to use the results to guide traditional reporting. Consequently, the entire project took about seven months.
With fully trained reporters and properly equipped computers, Finney said, this type of story can be done inexpensively and much more quickly. Nevertheless, reporters and editors must understand the limitations as well as the possibilities of statistical analysis and that no story is completely contained in the numbers. While such analysis helps us to construct a strong and detailed foundation, the soul of the story resides in our schools.
Carol Napolitano is Project Team Leader for the Omaha World-Herald and also oversees computer-assisted reporting. During the last months of the CAT scores project, she returned to school to earn a master’s degree in communication with a specialty in research and applied statistics.