Technology
March 23, 2009
A Digital Vision of Where Journalism and Government Will Intersect
‘… the journalistic process of assembling information and connecting the dots to inform tough questions will be easier.’
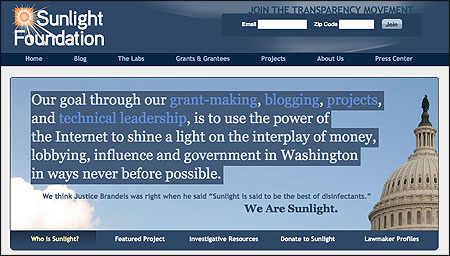
Soon after I came to work for the Sunlight Foundation, a Washington, D.C.-based nonprofit that uses the power of the Internet to bring greater transparency to government, I started to investigate the connection between a multimillion dollar Illinois highway project and some land owned by U.S. Representative Dennis Hastert, then the Speaker of the House. Applying tried and true investigative techniques from my time spent at The Philadelphia Inquirer and The Center for Public Integrity, I cultivated local sources, dug through public records, accumulated copies of deeds, plat maps, and Illinois Department of Transportation road plans. In time, I was able to determine that the cryptic “1/4 share in 69 acres (Plano, IL)” Hastert listed on his 2005 financial disclosure form was a parcel of property a few miles from a proposed exit along the route of a highway project called the Prairie Parkway.
Hastert had funded the parkway with a $207 million earmark that, thanks to his powerful position, he was able to insert at the last minute—with no review by his colleagues—into the 2005 transportation bill, known by the acronym SAFETEA-LU. A few months after securing funding for the highway, he sold his land to a real estate developer, making a neat two million dollar profit on property he held for less than a year.
The Sunlight Foundation published a story showing how the House speaker personally benefited from his legislative handiwork.
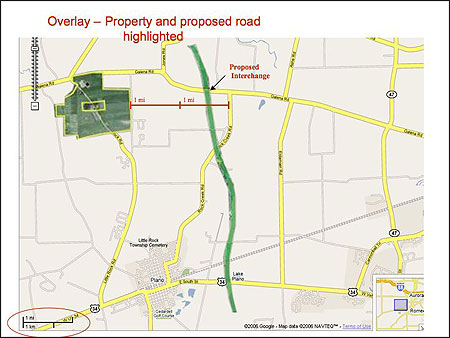
On the day Allison posted his story, a reader combined three maps to create this one, which illustrates the proximity of Hastert’s property to the Prairie Parkway project for which he earmarked funds. Image created by Tony Tyner.
Digital Public Access
A few months later, Andrew Rasiej, one of our senior technology consultants, gave a talk to a group of state and local politicians about Sunlight’s mission and work. He mentioned all the digging and meticulous spadework Sunlight used to break the Hastert story. Then he asked the audience to imagine something different: Suppose that the paper financial disclosure forms on which members of Congress each year must list their financial assets, debts, transactions and sources of income were instead put on the Internet with technology that made the information easily accessible for members of the public to view.
In this scenario, Hastert would not have listed a “1/4 share in 69 acres (Plano, IL.)” on a piece of paper filed away in the basement of the Capitol. Instead, his financial disclosure form would include a Google map showing the exact location of the land he owned. (It’s worth noting that ethics rules require members to disclose the location of property they own “sufficient to permit its identification, e.g., street address or plat and map location.”) Similarly, instead of the bland “U.S. I-80 to I-88 North-South Connector” line item in a transportation bill conference committee report, that $207 million highway earmark would also be put on a Google map, complete with the name of its sponsor and the amount of taxpayer money committed to it.
If this happened, anyone could overlay on a single map the two sets of data and see all of the nation’s road projects funded by congressional earmarks and all real estate investments of those same members of Congress.
Put aside the obvious hurdles for a moment—chief among them government’s reluctance to publish data in user-friendly formats. Try to envision what reporting would be like with lots of mashed-up (easily linked) data sets floating around.
What if digitized data and online reporting tools allowed reporters to cross-reference regional unemployment numbers, housing foreclosures, and bank reports to the FDIC with localized spending transactions from the Troubled Asset Relief Program (TARP) and the stimulus bill in only a few minutes? Very quickly, data-driven stories would emerge; one might be about a large, politically connected bank based in one city using TARP funds to expand by buying up smaller, sound banks in other cities that had avoided writing risky mortgages. Or perhaps an enterprising reporter would find that while her metro area suffered through double-digit unemployment, the bulk of the federal aid coming in was directed not to joblessness benefits and retraining, but to restoring footpaths in area parks.
We’re getting closer and closer to this being able to happen every day. Public demand for government transparency—for easy access to basic information about how government does everything from spend money to count votes—has never been higher; John McCain and Barack Obama pledged greater government transparency during their presidential campaigns. Meanwhile, new and improved technologies are putting more information at the fingertips of reporters faster than ever before.
Applying Technology to Journalism
Machines can translate paper documents into electronic formats, allowing reporters to quickly search them for key words and phrases. When the Senate released the hundreds of pages of the Emergency Economic Stabilization Act—the bailout bill—in 2008, Sunlight parsed the document and put it on our Web site (PublicMarkup.org) the same day. Its searchable format allows users to quickly navigate and even annotate the document. Now, in 2009, as Congress considered the American Recovery and Reinvestment Act—better known as the stimulus bill—an ad hoc coalition of government watchdogs and fiscal conservatives did the same thing as fast as we did without our help on a site called ReadTheStimulus.org.
Web-based platforms now exist for building databases and cleaning data that nonspecialists, of whom I am one, can use for free. I built a pair of databases using Dabbledb.com; a simple one listed donors to Bill Clinton’s presidential library. A more complicated one tracks congressional sponsors, beneficiaries and lobbyists of various trade bills that reduce tariffs (that is, taxes) on specific imported items for specific companies. Visualization tools let even an artistically challenged guy like me plug a bunch of numbers into a site like IBM’s Many Eyes and see trend lines on a graph, concentrations on a map, or pick out the really big numbers using a bubble gram.
As tools become more sophisticated and more data become available from government—and perhaps the private sector, if greater transparency is required from banks and corporations in the wake of the financial crisis—the investigative benefits experienced through computer-assisted reporting will become the norm. Access to data and easy-to-use tools to show quickly what it means will let reporters question those in power by bringing with them a tremendous amount of empirical information. And as reporters look for trends in their communities, they will be able to sort through much more data than they now can and use it to spot them.
None of this means it will be any easier to get a politician under the spotlight of scrutiny to answer a tough question. But the journalistic process of assembling information and connecting the dots to inform tough questions will be easier. By learning when and how to use these tools, journalists will no doubt be able to produce more substantive and informative stories, and they can do so at a time when the financial resources available for this kind of reporting are diminishing.
Bill Allison, a senior fellow at the Sunlight Foundation, was an investigative journalist at The Center for Public Integrity for nine years after working at The Philadelphia Inquirer as a researcher for Pulitzer Prize-winning investigative reporters Donald L. Barlett and James B. Steele.